A Training Matrix is a dynamic visual dashboard that tracks learners' training progress. It offers a detailed, all-in-one view of course or program enrollment status, progress, and completion—empowering admins, instructors, or team leaders to manage learning at scale.
The training matrix can be a useful tool for:
- Employee Onboarding: Track new hires' progress in mandatory training to ensure compliance.
- Skill Development: Monitor employee progress in development courses to identify skill gaps.
- Client Training: Oversee external users' training on products/services for better client satisfaction and partnerships.
In this guide, we will explore an overview of the training matrix, guide you through interpreting and reading the matrix, manage its view, and export the data to track your users' progress effortlessly.
How to monitor user progress (Training matrix)
LearnWorlds offers three distinct types of training matrix tools to help you monitor learner progress at various levels of granularity:
- General Training Matrix (Reports → Training Matrix): Provides a bird’s-eye view of users' progress across multiple individual courses. It's best for tracking user progress across standalone courses, company-wide compliance, or general training performance.
- Activity Matrix (Inside Individual Courses): This matrix offers detailed insights into learning activities such as videos, assessments, and SCORM files. It's ideal for instructors or admins who want to monitor engagement at the content level within a specific course.
- Learning Program Training Matrix (Inside each Learning Program): A high-level view of progress across courses grouped inside a Learning Program. It's great for tracking structured learning paths (e.g., onboarding programs, certification bundles, or career tracks).
General info about Training matrix
To locate the whole school's training matrix, navigate to Reports → Training Matrix.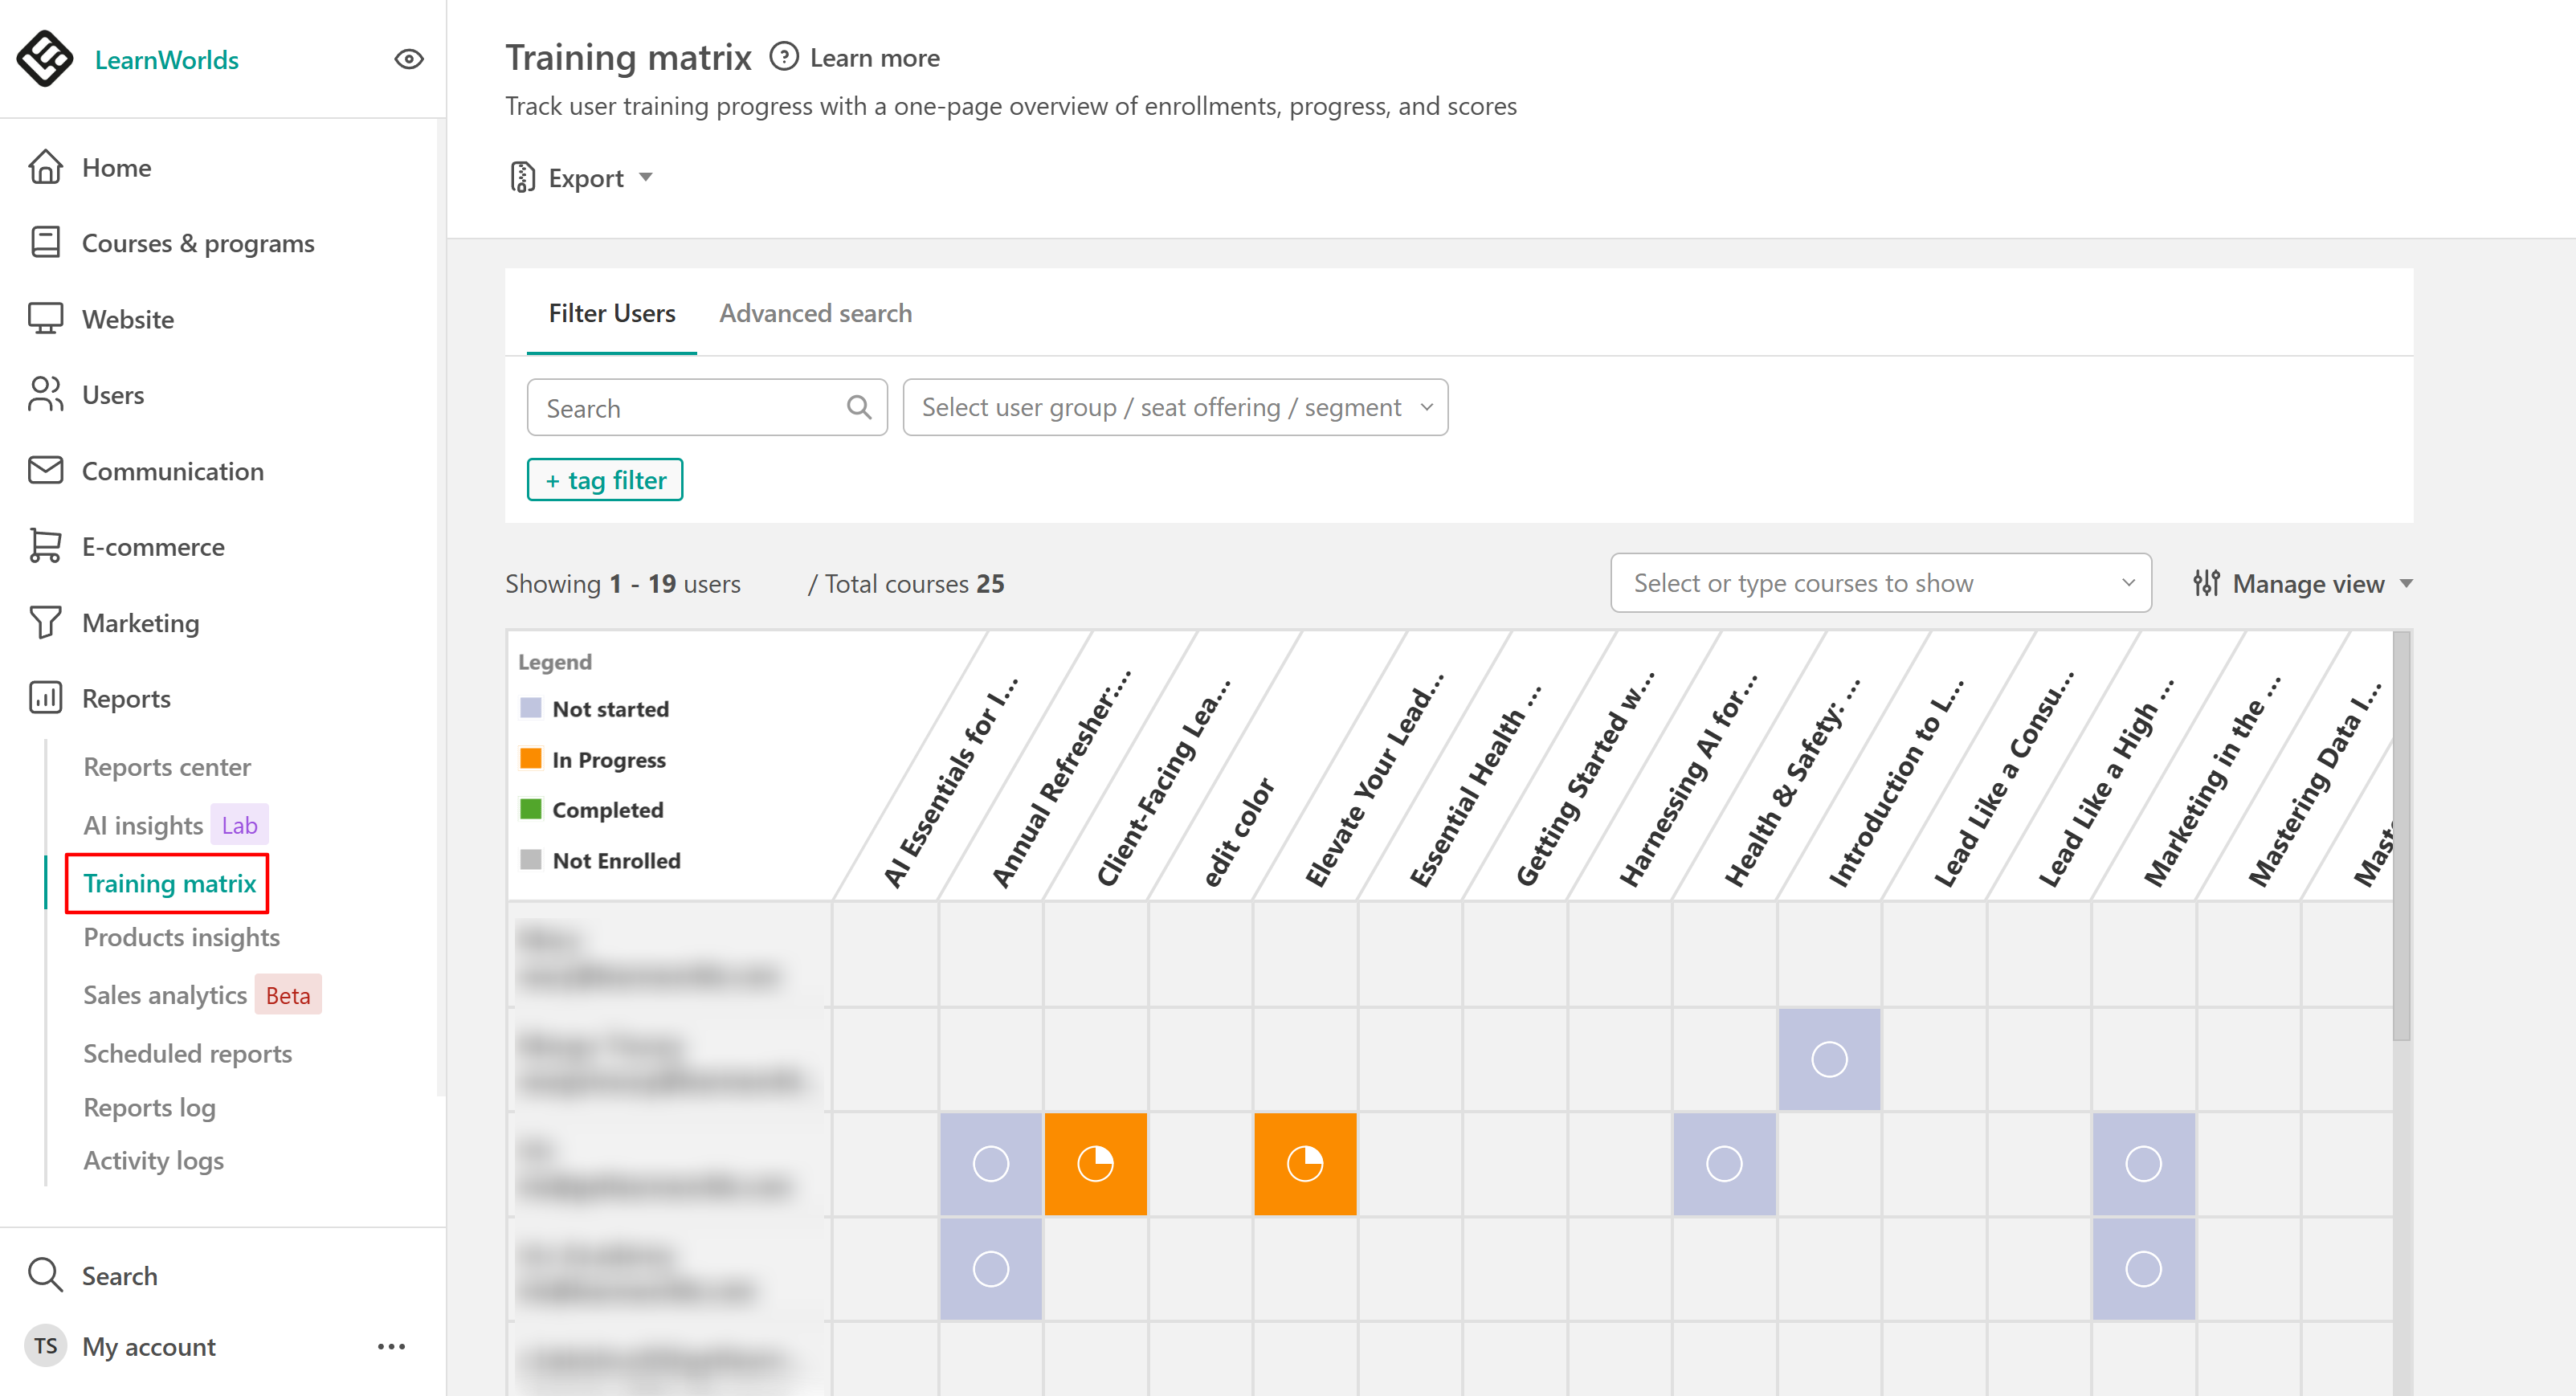
There is a search bar where you can search users by name, and various filters available. You can filter users by user group, seat offering, or user segments. Additionally, the advanced search feature (available on the Learning Center plan or above) allows you to apply multiple filters simultaneously.
You can also choose the courses to display in your view; by default, all available options are shown. To customize this, click the "Select Courses" button, and a drop-down menu will appear where you can add or remove courses.
Learning Program Training Matrix
The Learning Program Training Matrix provides a focused view of learners' progress within a specific learning program. While the interface and functionality are similar to the general training matrix, there are two key differences.
1. You will find it inside each Learning Program, under the Training Matrix tab.
2. This matrix displays only the courses included in that particular learning program, rather than all courses in the school. This ensures a clean, targeted view of learner progress within the program’s curriculum, making it easier to monitor structured learning paths.
Aside from the differences in location and course scope, the main settings and functionalities of the Learning Program Training Matrix remain the same as the general training matrix.
You can refer to the following sections of this guide for detailed instructions on how to filter users, customize views, interpret progress, and export data. If you're interested in more detailed insights specific to Learning Programs, be sure to check out our dedicated Learning Program Analytics Guide.
Manage the Training Matrix View
To customize your table and manage the view of your training matrix, click on Manage View. Based on your choices, the view of the table will change, and the respective options will be shown.
The available options are:
1. The status users have in the courses:
- Not started
- In progress
- Completed
- Not Enrolled
For each option you select, the corresponding color will be displayed. For example, if you choose 'Completed,' green boxes will appear. You can also select multiple options simultaneously, such as 'Completed' and 'In Progress,' to see both color indicators.
2. Cell Content: When a course is completed, it becomes green and shows one of the available options
- Default ( Symbols)
- Score
- Progress
Based on the option you choose, you will see either icons (e.g. checkmark for completed course), the score the user has in the included assessments, or the percentage of the user's progress inside the course.
3. You can sort users and courses by:
- (A-Z) Ascending
- (Z-A) Descending
- New
4. Hide courses with no users. Courses that don't have any enrollments yet.
You can also click on each box to get more details for each course/ user; you can see their info like progress, score, study time, completion date, and when they were enrolled in the course.
Interpret and Read the Training Matrix
- Symbols. By default, the system displays results using symbols. Completed courses are shown with green boxes featuring a check mark (✅), while courses in progress are indicated with orange boxes displaying a progress diagram. For courses in progress, the orange boxes represent the following percentage ranges: 0-25%, 26-50%, 51-75%, and 76-99%.

- Progress. When you choose this option, symbols will be replaced by the percentage of the user's progress. The result remains the same as with the symbols, but now you can see the actual percentage.

- Score. With this option, you will see the user's score in the courses, calculated based on the scores the user has achieved in the assessments included in the course. If a user doesn't have a score, the box will remain colored but won't show a number.
- Filter users. This feature allows you to filter users by name using the search bar. You can also search within user groups, seat offerings, or segments. For more refined filtering, the advanced search function (available on the Learning Center plan and above) allows you to apply all of the school's filters for more precise results. For example, you can display only users enrolled within a specific date range.

Export Progress
After customizing your view, you can export the results by clicking the Export link button and selecting a CSV or Excel (XLS) file. 
Exporting the results of a training matrix is crucial for documentation, reproducibility, analysis, and reporting, ensuring that model performance is well-documented, comparable, and easily understandable for stakeholders and team members.