
Recurring revenue helps you understand how your subscription business is performing. It allows you to monitor recurring revenue growth, identify what drives MRR changes, measure retention and churn, track subscriber activity, and evaluate trial conversion performance.
With dedicated dashboards for recurring revenue, subscriber behavior, retention, and trials, you can better understand the health of your subscription business and make informed decisions to improve growth and customer retention.
In this article, we will learn how to access Recurring Revenue, apply filters, interpret each available dashboard, and understand the key subscription metrics.
What is recurring revenue?
Recurring revenue is a collection of dashboards for subscription-based revenue, including:
- MRR & ARR
- MRR Movements
- Retention & Churn
- Subscribers & Subscriptions
- Trials
Use cases
Here are some practical ways to use recurring revenue:
- Monitor subscription revenue growth.
- Understand the drivers behind MRR changes.
- Measure retention and churn.
- Track subscriber and subscription activity.
- Evaluate trial conversion performance.
Access recurring revenue reports
From your admin dashboard:
1. Go to Reports → Sales Analytics.
2. Open Recurring revenue from the left-side menu.
3. Select the dashboard you want to view:
- MRR & ARR
- MRR Movements
- Retention & Churn
- Subscribers & Subscriptions
- Trials
Use the filters and date range selector at the top of the page to refine your data.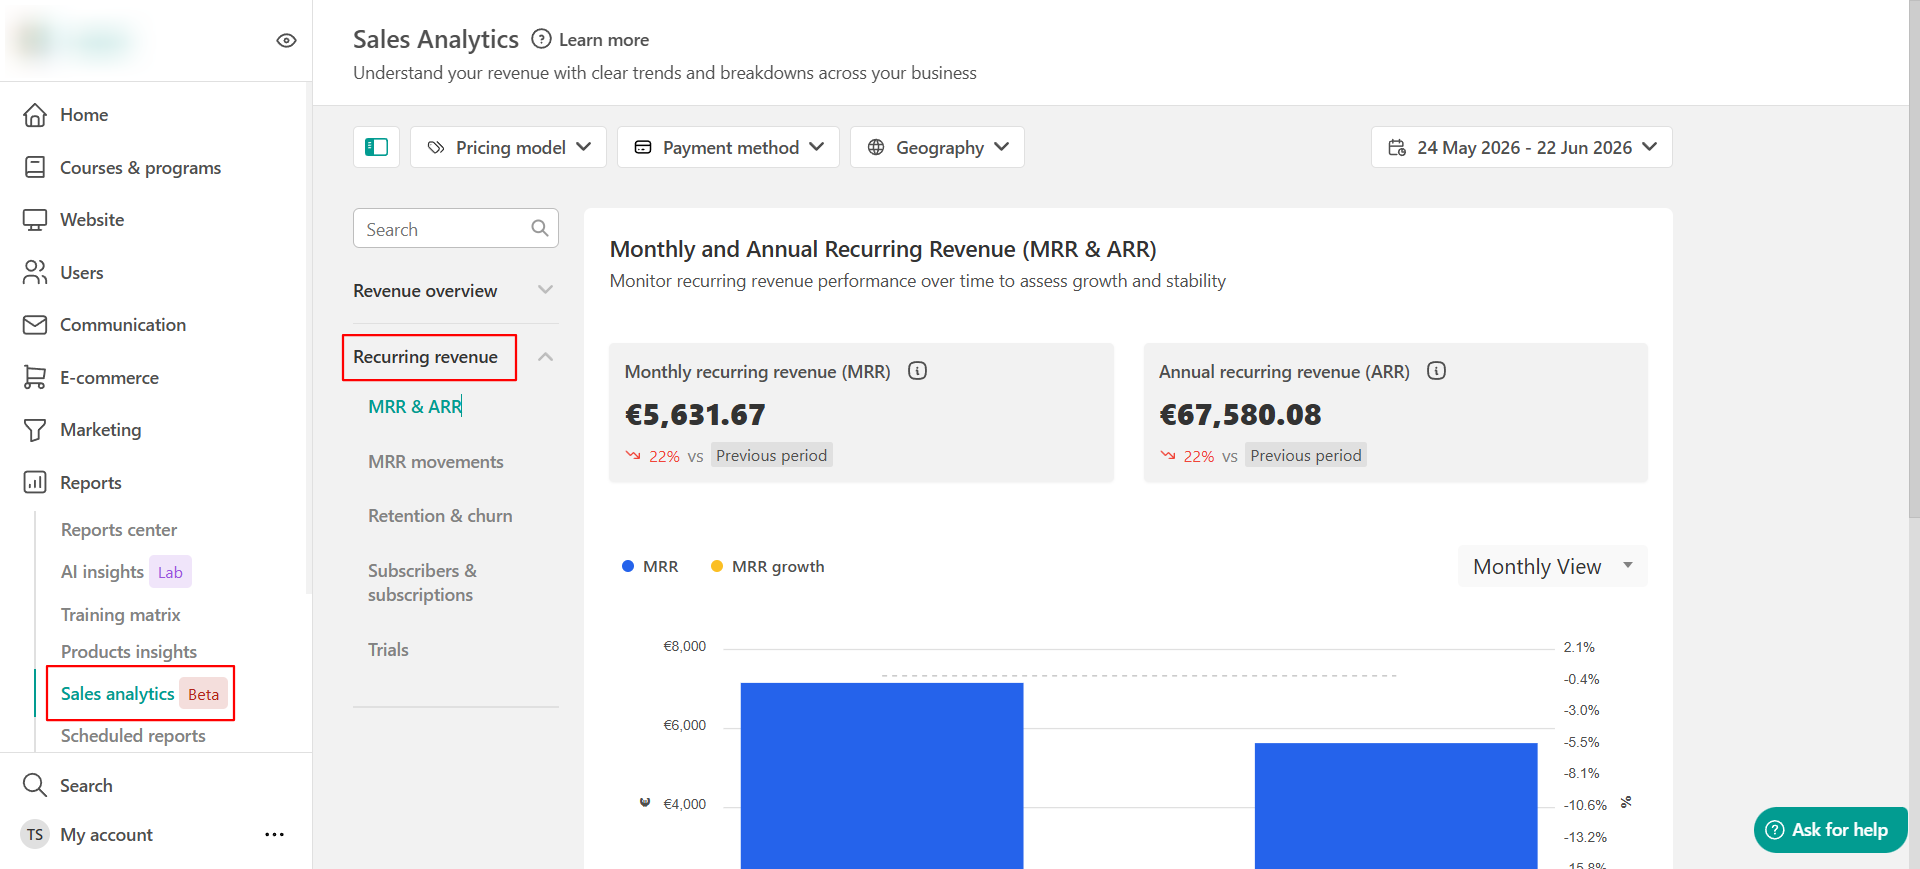
Understanding recurring revenue metrics
Recurring Revenue reports include two types of metrics:
- Snapshot metrics show the current state of your subscription business at the end of the selected date range. Examples include MRR, ARR, Active Subscribers, Active Subscriptions, and Active Trials.
- Date-range metrics show activity that occurred during the selected period. Examples include New MRR, Churn MRR, Net MRR Movement, New Subscribers, Churned Subscribers, New Trials, and Trial Conversion Rate.
For example, if you select the last 90 days, MRR reflects the value of active subscriptions at the end of that period, while New MRR and Churn MRR show recurring revenue gained or lost during those 90 days.
MRR & ARR
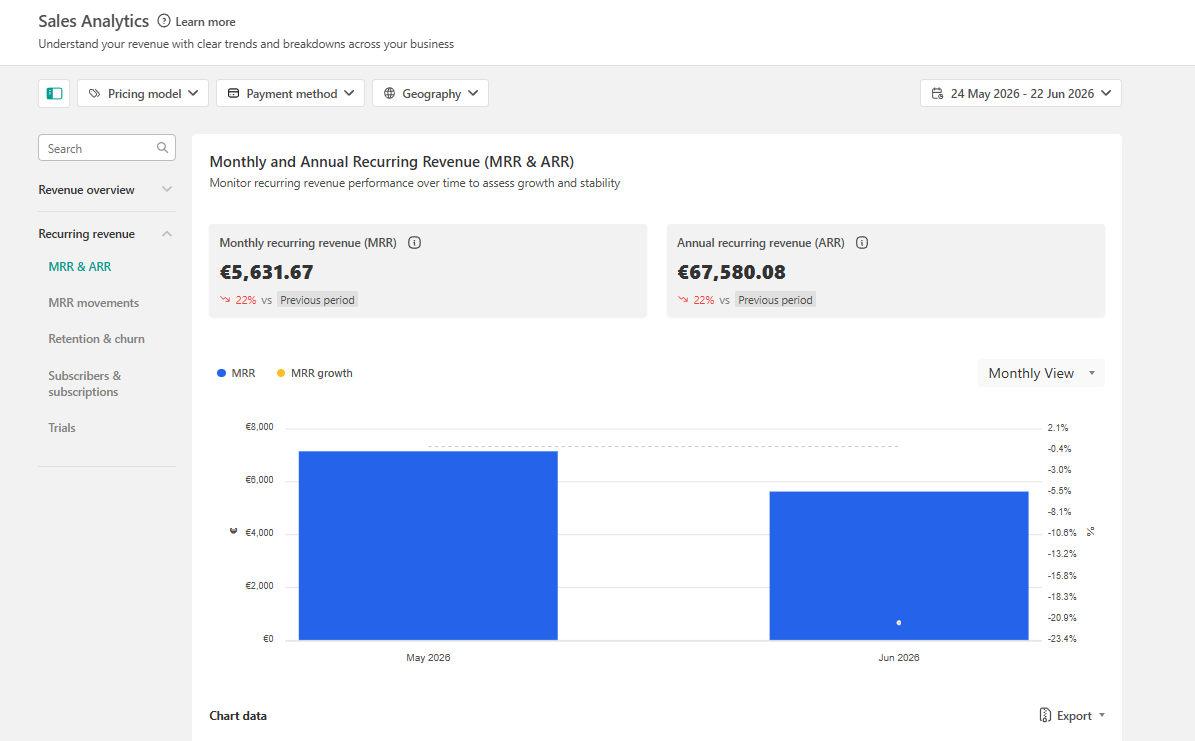
The MRR & ARR dashboard helps you monitor recurring revenue performance over time. To provide a consistent view of subscription revenue, MRR normalizes all subscription plans to a monthly value.
 MRR is not the amount collected during the selected period. It represents the normalized monthly value of active paid subscriptions at the end of the selected date range.
Because MRR measures subscription value rather than payments collected, MRR figures will not necessarily match your sales or payment collection reports.
The dashboard includes the following metrics:
- Monthly recurring revenue (MRR) is a snapshot metric. It shows the normalized monthly value of active paid subscriptions at the end of the selected date range, (MRR = Sum of normalized monthly value of active subscriptions).
- Annual recurring revenue (ARR) is a run-rate metric based on MRR, (ARR = MRR × 12)
- MRR growth rate compares the ending MRR of the selected period with the ending MRR of the previous equivalent period. It measures the percentage change between these two MRR snapshots using the following formula, ((Current MRR − Previous MRR) / Previous MRR) × 100
- MRR over time shows recurring revenue snapshots over time.
How to interpret the report
- Increasing MRR generally indicates subscription growth.
- Decreasing MRR may indicate churn, downgrades, or subscription cancellations.
- A positive MRR Growth Rate means recurring revenue increased compared to the previous equivalent period.
- A negative MRR Growth Rate means recurring revenue decreased.
- Trial subscriptions are excluded from MRR calculations.
- ARR is a run-rate metric and does not represent actual yearly revenue.
- MRR includes subscriptions that are active and past due.
- MRR excludes subscriptions that are trialing or canceled after their effective end date. Scheduled cancellations are included while the subscription is still active.
- MRR uses the net recurring subscription price.This means that, recurring discounts and coupons are included, taxes are excluded, refunds and write-offs do not change MRR.
- MRR reflects the subscription’s effective recurring value at the selected point in time.
- Manual Offline transactions do not generate subscription MRR. They do not affect: MRR, ARR , Subscriber metrics, Subscription metrics, Retention, Churn.
- If a customer has multiple active subscriptions, all active subscriptions are included in MRR. MRR is not deduplicated at the customer level.
- Subscriptions are converted into a monthly value before they are included in MRR.
| Billing interval | Monthly MRR calculation |
| Monthly | Amount |
| Yearly | Amount / 12 |
| Weekly | Amount × 52 / 12 |
| Daily | Amount × 365 / 12 |
| Every Y years | Amount / (12 × Y) |
Every M months | Amount / M |
| Every W weeks | Amount × 52 / (12 × W) |
| Every D days | Amount × 365 / (12 × D) |
MRR movements
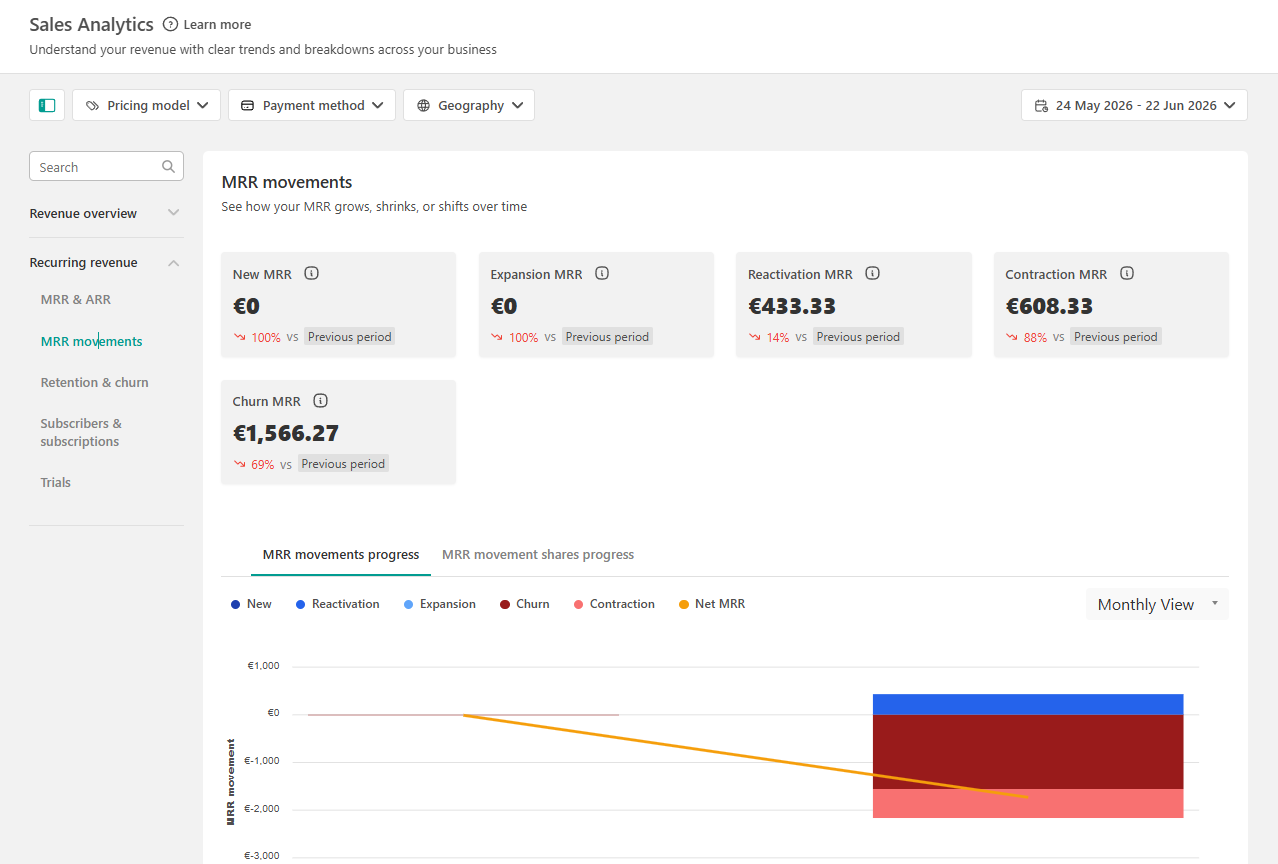
MRR Movements are date-range metrics. They show what caused recurring revenue to increase or decrease during the selected date range. The available metrics are:
- New MRR: Recurring revenue added from new paid subscriptions during the selected date range. (Net MRR = New MRR + Expansion MRR + Reactivation MRR − Contraction MRR − Churn MRR).
- Expansion MRR: Additional recurring revenue generated when an existing subscriber increases the recurring value of their subscriptions (for example through upgrades, recurring discount removal, or higher-value subscriptions
- Reactivation MRR: Recurring revenue generated when previously inactive subscribers became active again during the selected date range.
- Contraction MRR: Recurring revenue lost from downgrades, recurring discounts, or subscription value decreases during the selected date range.
- Churn MRR: Recurring revenue lost when subscribers canceled their last active subscription during the selected date range.
- Net MRR movement: The net change in recurring revenue during the selected date range.
How to interpret the reports
- High New MRR and High Churn MRR may indicate strong acquisition but weak retention.
- High Expansion MRR usually indicates successful upgrades or upsells.
- High Contraction MRR may indicate downgrades or recurring discounts.
- High Churn MRR may indicate cancellation or retention issues.
Retention & Churn
Navigate to Recurring Revenue → Retention & Churn to evaluate the health of your subscription business. Retention and churn metrics are date-range metrics. They measure how much recurring revenue or subscriber activity was retained or lost during the selected date range.
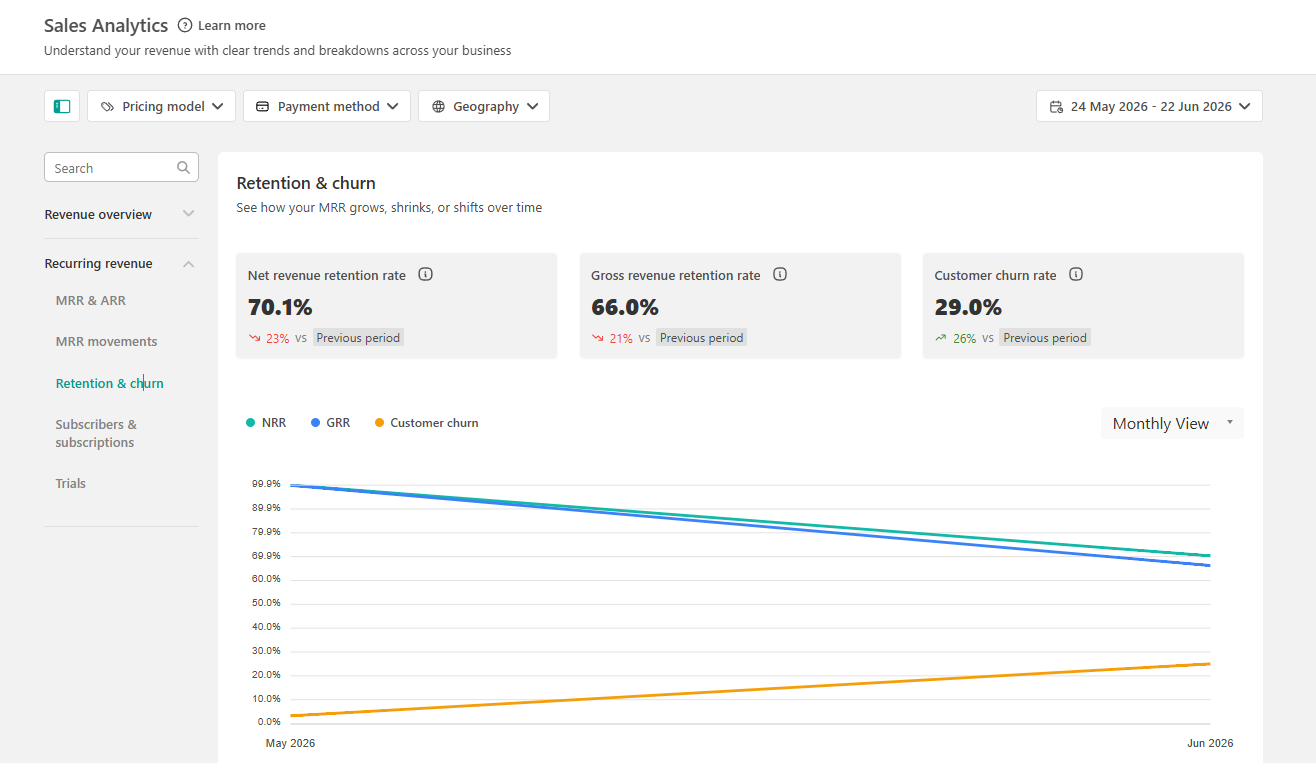
The available Metrics are:
- Gross revenue retention(GRR): Measures how much recurring revenue was retained from existing subscribers, excluding expansion revenue, ( GRR= Sum of min(Start MRR per customer, End MRR per customer) / Sum of Start MRR)
- Net revenue retention (NRR): Measures how much recurring revenue was retained from existing subscribers, including expansion revenue, (NRR = Sum of End MRR from starting customers / Sum of Start MRR from starting customers).
- Customer churn rate: Measures the percentage of subscribers who stopped generating recurring revenue during the selected period, (Customer Churn Rate = Churned Customers / Customers at Start).
- Retention & churn trend chart: Visualizes retention and churn performance over time.
How to interpret the reports
- High GRR and NRR indicate strong subscriber retention.
- Low GRR indicates revenue loss through churn or downgrades.
- NRR above 100% means expansion revenue exceeded churn and contraction losses.
- NRR below 100% means existing customers generate less recurring revenue than before.
Retention metrics are calculated only for subscribers who had recurring revenue at the beginning of the selected period. New subscribers acquired during the period, or reactivated subscribers who were not active at the beginning of the selected period, are excluded from retention calculations.Subscribers & Subscriptions
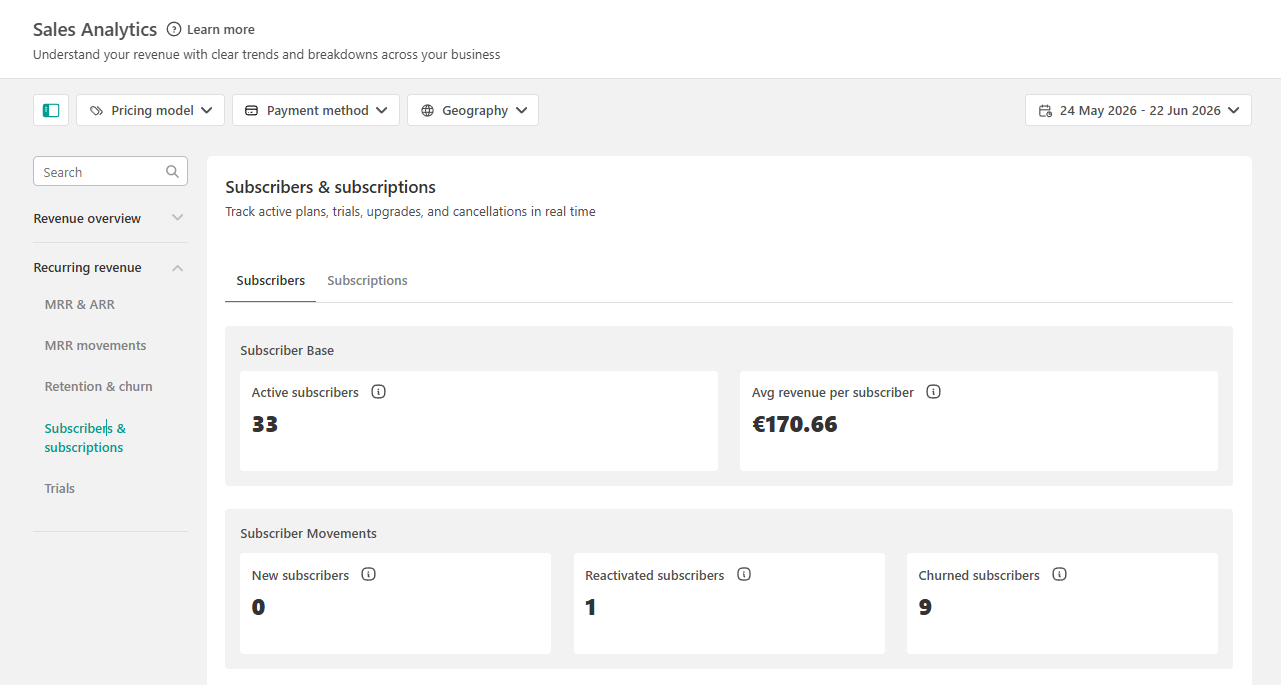
The Subscribers & Subscriptions dashboard helps you monitor subscriber growth, subscription activity, and subscriber value over time. The dashboard includes two tabs:
1. The Subscribers tab focuses on subscriber-level activity. The available metrics are:
- Active subscribers is a snapshot metric that shows the number of subscribers with at least one active paid subscription at the end of the selected date range.
- Average revenue per subscriber is a snapshot metric that shows the average recurring revenue generated per active subscriber at the end of the selected date range.
- New subscribers is a date-range metric that shows subscribers who started their first paid subscription during the selected date range.
- Reactivated subscribers is a date-range metric that shows previously inactive subscribers who became active again during the selected date range.
- Churned subscribers is a date-range metric that shows subscribers who stopped having any active paid subscription during the selected date range.
How to interpret the report
- Increasing active subscribers generally indicates customer growth.
- A growing average revenue per subscriber may indicate successful upselling or higher-value subscriptions.
- High new subscribers combined with high churned subscribers may indicate acquisition and retention challenges occurring simultaneously.
- Growing reactivated subscribers may suggest successful re-engagement efforts.
- A declining subscriber growth rate may indicate slowing acquisition or increasing churn.
2. The Subscriptions tab focuses on individual subscriptions. Since a subscriber can have multiple subscriptions, this view helps you monitor subscription-level changes:
- Active subscriptions is a snapshot metric that shows the number of active paid subscriptions at the end of the selected date range.
- New subscriptions is a date-range metric that shows subscriptions started during the selected date range.
- Reactivated subscriptions is a date-range metric that shows subscriptions reactivated during the selected date range.
- Canceled subscriptions is a date-range metric that shows subscriptions canceled during the selected date range.
This view is useful for understanding subscription activity independently of subscriber counts.
- Canceling a subscription does not always equal customer churn. If a customer still has another active subscription, the lost revenue may contribute to Contraction MRR rather than Churn MRR.Trials
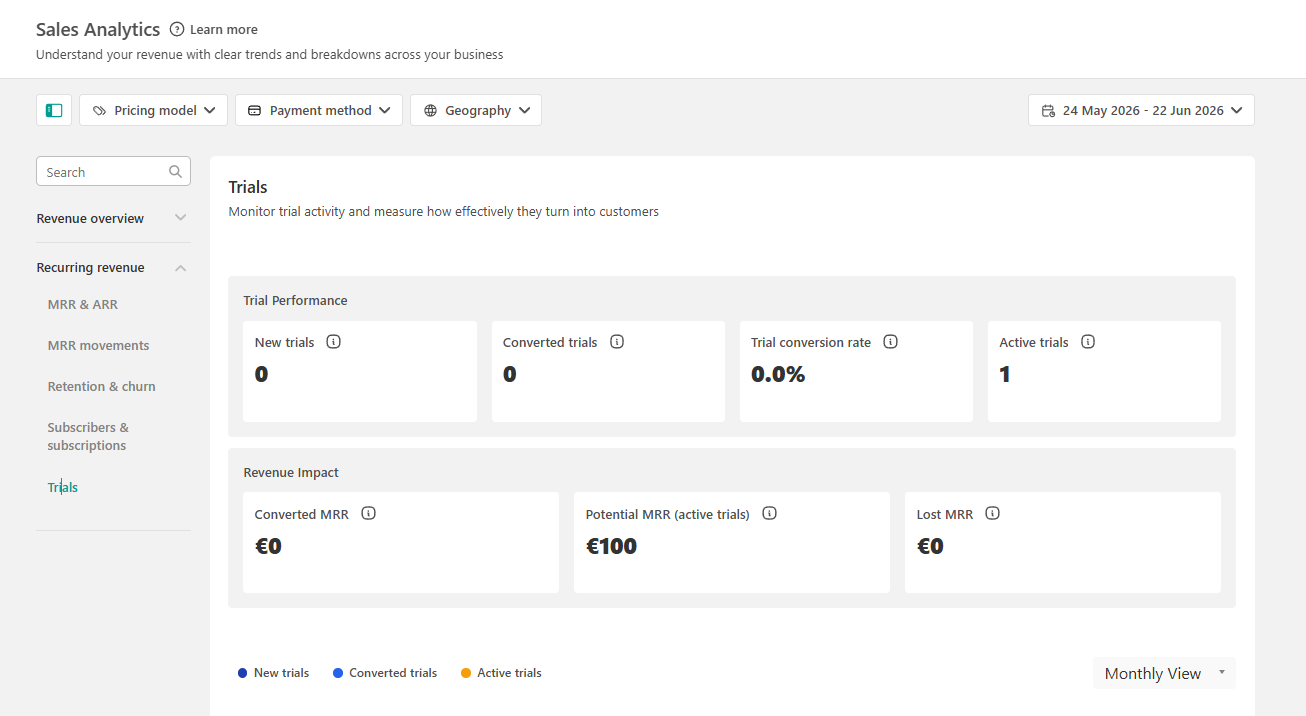
The trials dashboard helps you evaluate trial performance and conversion effectiveness. The available metrics are:
- Active trials is a snapshot metric. It shows trials that are active at the end of the selected date range.
- New trials is a date-range metric. It shows trials started during the selected date range.
- Converted trials is a date-range metric. It shows trials that converted into paid subscriptions during the selected date range.
- Trial conversion rate shows the percentage of finished trials that converted into paid subscriptions during the selected date range, (Trial Conversion Rate = Converted Trials ÷ Finished Trials)
Finished Trials include all trials that either converted or ended without converting during the selected date range. - Converted MRR is a date-range metric. It shows recurring revenue generated from trials that converted during the selected date range.
- Potential MRR is a snapshot-style estimate. It shows the estimated recurring revenue that could be generated if all trials active at the end of the selected date range converted into paid subscriptions.
- Lost MRR is a date-range metric. It shows recurring revenue lost from trials that did not convert during the selected date range.
How to interpret the report
- High trial volume with low conversion may indicate onboarding or value-delivery issues.
- High conversion with low trial volume may indicate a strong offer but limited acquisition.
- High Potential MRR highlights future revenue opportunities.
- High Lost MRR may indicate opportunities to improve trial engagement and conversion.
Filters, Date Range, and Granularity
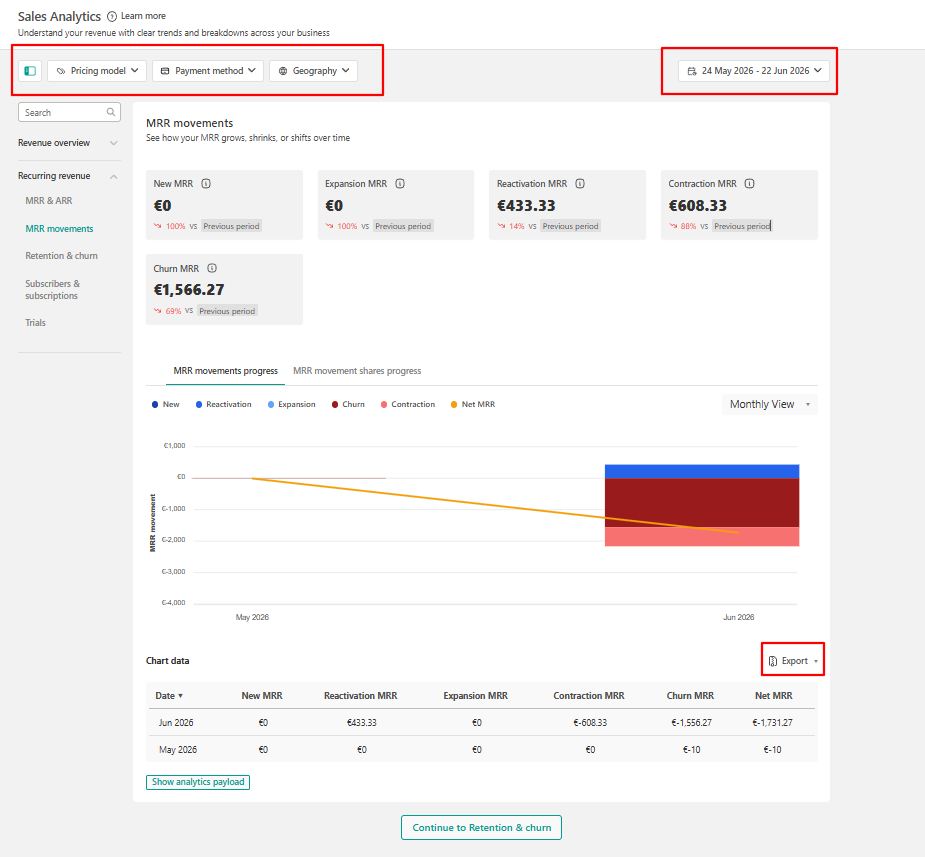
Use filters and date ranges to focus your analysis on the data most relevant to your business.Depending on the dashboard, you can:
- Select a date range
- Change chart granularity
- Apply available filters
- Export report data
Best Practices
- Start with MRR & ARR to understand overall subscription growth.
- Use MRR Movements to identify what caused recurring revenue changes.
- Review Retention & Churn regularly to identify subscriber health issues early.
- Compare subscriber growth with MRR growth to determine whether revenue growth comes from acquisition or expansion.
- Monitor Trial Conversion Rate to optimize your subscription funnel.
- Investigate increases in Contraction MRR or Churn MRR as early warning indicators of retention issues.
Understanding your metrics
- MRR is a snapshot metric and does not represent collected revenue.
- ARR is an annualized run-rate metric and not actual annual revenue.
- Trial subscriptions are excluded from MRR calculations until they convert into paid subscriptions.
- Manual Offline transactions do not contribute to recurring revenue metrics.
- Revenue totals are not intended to match payment collection reports.
Historical data availability
The Recurring Revenue dashboards were released on July 17, 2026. Data for these dashboards is available from that date onward.
As of July 17, 2026, the following snapshot metrics are available:
- MRR
- ARR
- Active Subscribers
- Average Revenue per Subscriber
- Active Subscriptions
- Active Trials
- Potential MRR
Data for dates before July 17, 2026 is not available. From July 17, 2026 onward:
- Additional snapshot values are recorded, allowing trends to be viewed over time.
- Date-range metrics, such as MRR Movements, retention and churn, subscriber and subscription changes, and trial conversion metrics, accumulate activity.
Because these dashboards depend on subscription data collected over time, trends, comparisons, and date-range results become more complete over time.
FAQs
1. Why doesn't MRR match total subscription sales?
MRR is a recurring revenue snapshot rather than collected revenue. It normalizes active subscriptions into a monthly value and excludes trial subscriptions and Manual Offline transactions.
2. Why doesn't ARR match actual yearly revenue?
ARR is a projected annual run-rate based on current MRR, (ARR = MRR × 12)
3. Why is MRR Growth Rate displayed as "-"?
The metric is unavailable when there is no valid previous-period MRR value or when the previous MRR equals zero.
4. Why can NRR be above 100%?
NRR exceeds 100% when expansion revenue from existing subscribers is greater than revenue lost through churn and contraction.
5. Are trials included in MRR?
No. Trial subscriptions are excluded until they convert into paid subscriptions.
6. Can I export these reports?
Yes. Users with the appropriate export permissions can export reports using the currently selected filters and date range.
7. Why doesn’t MRR match the subscription revenue collected during the selected period?
MRR is a snapshot metric, not a collected revenue metric. It shows the normalized monthly value of active paid subscriptions at the end of the selected date range. It does not show the total amount collected during that period.
8. Why don’t active subscribers match new subscribers?
Active Subscribers is a snapshot metric that shows how many subscribers are active at the end of the selected date range. New Subscribers is a date-range metric that shows how many subscribers started their first paid subscription during the selected date range.
9. Why don’t active trials match new trials?
Active Trials is a snapshot metric that shows trials still active at the end of the selected date range. New Trials is a date-range metric that shows trials started during the selected date range.
10. Why did my recurring revenue increase or decrease?
Recurring revenue changes are explained by the MRR Movements metrics. Revenue increases come from New MRR, Expansion MRR, and Reactivation MRR, while decreases come from Contraction MRR and Churn MRR. Reviewing these metrics helps you understand what drove changes in your recurring revenue during the selected date range.